CROSSOVER DASHBOARDS v2.
Auditing Recommendation Algorithms: A Critical Tool Against Disinformation and Misinformation. #Digivaalivahti

Welcome to CrossOver, where data meets integrity in the fight against digital disinformation and misinformation. In an era where social media algorithms shape narratives and influence public opinion, our suite of dashboards serves as a tool for journalists and researchers seeking truth and transparency.
The CrossOver dashboards specialise in monitoring and analysing the recommendation algorithms of major online platforms. Our dashboards offer a unique lens through which the intricacies of these algorithms are made visible and understandable. From Google News trends to YouTube's recommendation dynamics, we provide near real-time insights into how these platforms may be unwittingly or deliberately shaping user engagement and content dissemination.
Our mission goes beyond mere observation; we empower media professionals and researchers with the data needed to identify and expose disinformation operations. By unraveling the complex web of online suggestions, trends, and content propagation, CrossOver enables informed decision-making and the development of strategies to counteract the spread of false information.
Each of our dashboards is tailored to a specific platform, offering specialised tools and analytics. Whether it’s examining Instagram content trends, analysing Mastodon's emerging topics, or scrutinising TikTok's viral mechanisms, our tools are designed to provide comprehensive, actionable insights.
CrossOver is more than a set of tools; it's a commitment to uphold factual integrity in the digital age. Explore our dashboards and join us in the pursuit of a more informed and truthful online discourse.
How to Use the CrossOver Dashboards?
1. Select Your Region
Begin by choosing the region you're interested in from the dropdown menu. For example, if you're focusing on Helsinki, Finland, select 'FIHEL', Paris, France, 'FRPAR'.
2. Choose Your Keyword
Pick a keyword relevant to your research from the list of options. These keywords are tailored to each region for more precise results.
3. Set Your Time Range
Specify the start and end dates for your analysis. This allows you to focus on the time frame that matters most to your research.
4. Click 'Submit'
Once you've set your parameters, click the 'Submit' button. The dashboard will then generate and display the data based on your selections.
5. Explore the Dashboard
Navigate through the dashboard to view various data visualizations and analyses. Each dashboard offers unique features tailored to the specific platform.
6. Interpret the Data
Use the insights provided by the dashboard to gain a deeper understanding of trends, algorithm behaviors, and content impacts within your selected region and time frame.
Select your data source

Google News
Navigate the Evolving World of News with the Google News Dashboard. This tool provides real-time insights into global news trends, allowing you to track and analyse narratives as they unfold. Select a country, input keywords, and explore a customised summary of news articles within your specified time frame. Ideal for journalists and researchers seeking to understand and report on current events with depth and accuracy.

Search Engines
Explore the Mechanics of Online Search with our Search Engine Suggestion Dashboard. Delve into the behaviours of top search engines like Google, Bing, and DuckDuckGo. This dashboard reveals the nuances of search engine suggestions, offering a comprehensive view of how different algorithms interpret user queries. A critical tool for researchers and media professionals looking to understand and compare the digital pathways shaped by these search giants.

Discover Instagram's Content Landscape with the Instagram Insights Dashboard. This tool specialises in analysing trends, author activities, and user engagement on Instagram. Track the most prolific authors, understand post interactions, and identify top-performing content. Essential for researchers and journalists who want to uncover patterns and insights from one of the most influential social media platforms.
Mastodon
Uncover the Pulse of Mastodon with our Mastodon Trends Analysis Dashboard. Designed to track and analyse trending topics across Mastodon instances, this tool offers a day-by-day breakdown of emerging discussions. Its detailed timeline graph illustrates the popularity and lifespan of trends, making it an invaluable resource for understanding the dynamics of this growing social network.

TikTok
Dive into TikTok's Viral Mechanisms with the TikTok Trends Dashboard. This tool is expertly crafted to analyse content trends, user engagement, and hashtag performance on TikTok. Monitor the impact of viral content, track emerging trends, and gain a deeper understanding of how TikTok's algorithm promotes content. An essential dashboard for those investigating the fast-paced world of one of the most influential social platforms.

YouTube
Analyse YouTube's Algorithm with the YouTube Insights Dashboard. Focused on dissecting YouTube's search results and recommendation algorithms, this dashboard provides insights into the most visible channels and videos for selected keywords. Understand what content gets recommended and gain a comprehensive view of YouTube's influence on viewership and content distribution.
Frequently Asked Questions (FAQ)
How is the data on the dashboards sourced?
We use a combination of official platform APIs and distributed computing methods to browse platform websites as fresh, unconnected users. This approach ensures a wide coverage of data.
Can I choose any timeframe for the data?
The time selector on our dashboards is limited to a two-week period to ensure focused and relevant results.
How are the keywords for analysis chosen?
Keywords are carefully selected by editorial committees, comprising members from CheckFirst and our media partners, ensuring relevance and timeliness.
Is it possible to add custom keywords for analysis?
Currently, the keywords are fixed and chosen by editorial committees. We do not offer the option to add custom keywords.
What is the primary use of these dashboards?
These dashboards are designed for researchers and journalists to analyze the influence of recommendation algorithms on major platforms, providing insights into content trends and user interactions.
Can I use the dashboard data for my own research project?
Absolutely! The data is available for research purposes. Please contact CheckFirst via email for access.
Is it possible to get data specific to my country?
We're open to collaborations. Please contact us to discuss possibilities tailored to your country.
Does the dashboard display all the data you have?
Not all the data we collect is displayed on the dashboards. We curate the data to ensure relevance and clarity in presentation.
Can I export data directly from the dashboard?
Direct export from the dashboards is not available, but we do provide an API for data access. Contact us for more details.
In Action
Discover the real-world impact of the CrossOver dashboards. Discover how our tools have been used in research, revealing hidden biases and uncovering the truth behind algorithm-driven narratives in social media. From analysing the intricacies of search engine suggestions to exposing the subtle manipulations in news algorithms, these case studies demonstrate the power and necessity of our dashboards in today's digital information landscape. Dive into each study to see how CrossOver is not just a tool, but a catalyst for change and understanding in the ongoing battle against disinformation and misinformation.

Amazon's Recommendation Algorithm: Concerning Content and User Entrapment
A comprehensive examination of Amazon's algorithm, highlighting the amplification of questionable content and the potential entrapment of users in dubious narratives.
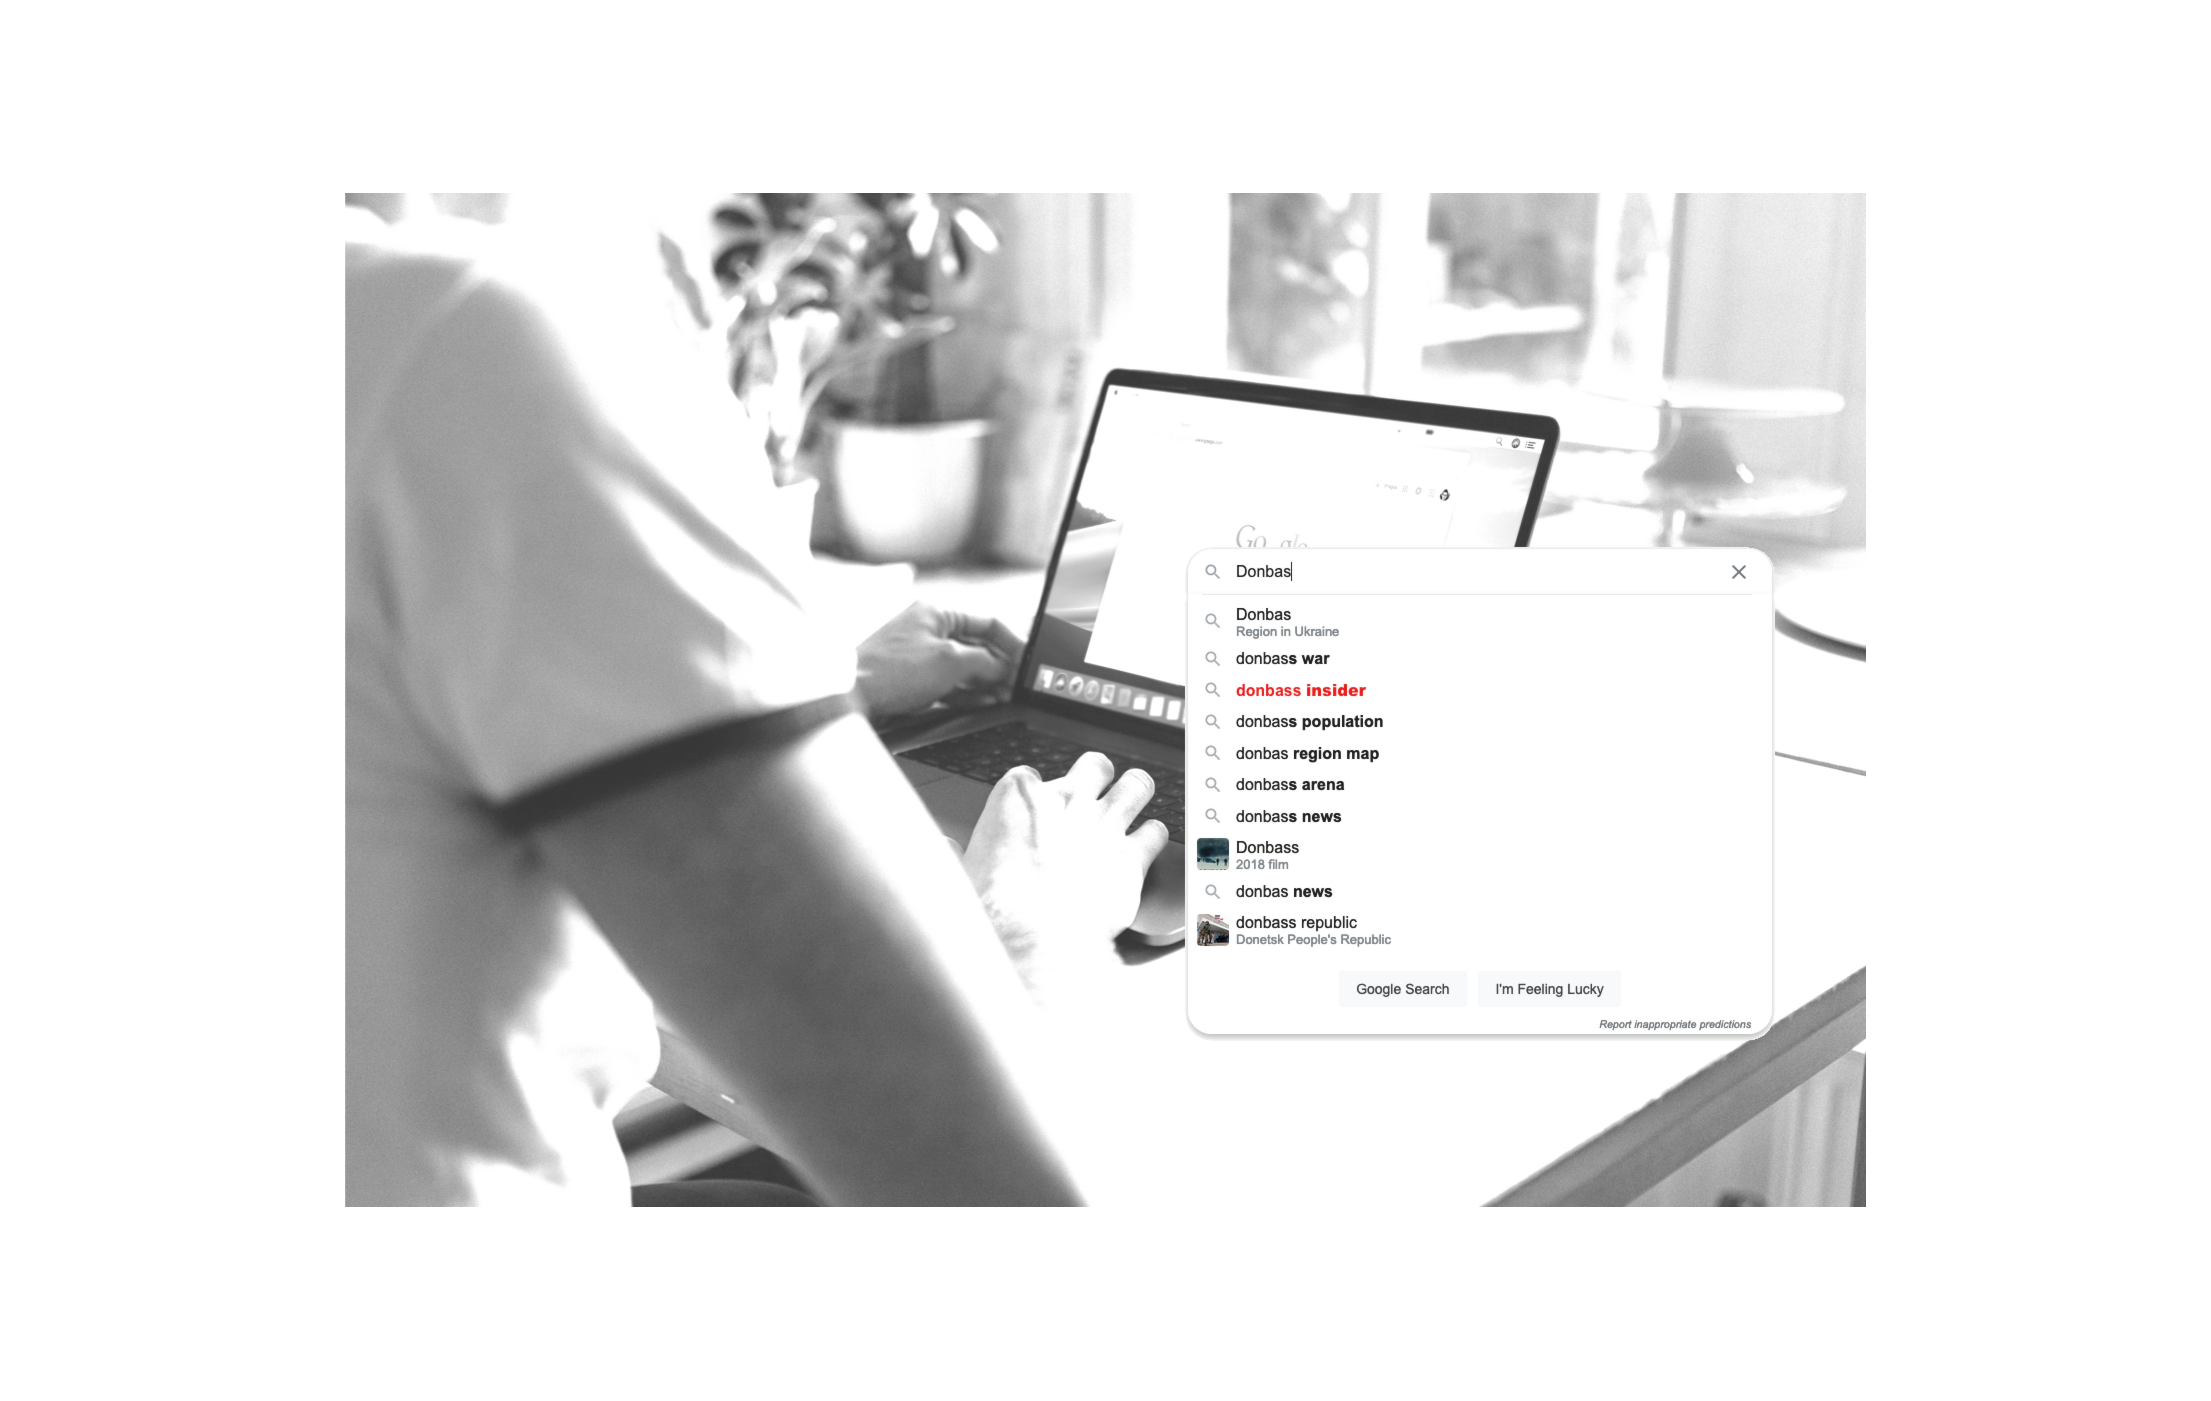
Google's Autocomplete and Disinformation on Donbas
Investigates how Google's autocomplete feature may spread misinformation about the Donbas region, subtly influencing public understanding of this geopolitical issue through search engine suggestions.

Chinese Media's Influence in Google News on Xinjiang
This paper delves into the influence of Chinese state-controlled media within Google News, particularly regarding Xinjiang, raising questions about the manipulation of news narratives and the resilience of algorithmic curation.
YouTube's Algorithmic Shift Following EU's Ban of Russian Channels
Examines YouTube's algorithmic preferences after the EU ban of Russia Today and Sputnik, noting a shift towards CGTN Français, a Chinese state-run media, and the implications for content recommendation in the context of Russia-related information.
With the support of
CrossOver has received funding in 2024 from European Information and Media Fund under grant agreement 290233. EMIF managed by the Calouste Gulbenkian Foundation
CrossOver has received funding in 2023 from the Mozilla Tech Fund.
CrossOver is supported by the OVH Startup Program

CrossOver has received funding in 2022 from the European Union’s programme on the financing of Pilot Projects and Preparatory Actions under grant agreement LC-01682253
Project partners